You fill your API accounts into BestNav. Once the relay is on, the panel exposes its own OpenAI-compatible URL. Point Cursor, Cline or Claude Code at that URL with the key the panel gives you, and no tool needs to remember five endpoints and five keys any more.
One URL for everything — switching upstream never means editing your tools
Automatic failover — quota exhausted, 429 or upstream failure drops to the next tier instead of breaking your session
Per-request ledger — which account, which model, how many tokens, estimated cost, latency, status code
Token savings — bulky tool output gets compressed before it leaves, and the saving is measured
Stays on your box — the relay only forwards; it never ships your prompts to a third party, and the ledger can be wiped anytime
Diagram: tools see one entry point; the relay queues four tiers — subscription, low-cost, free, local — and falls to the next when a call fails.
It is not magic: the relay is a receptionist running on your own NAS. It does not rewrite your prompt and never asks a model on your behalf — it only decides who to hand the request to, when to hand it to the next one, and how to write it down.
The nine screens, one question each
Once inside the relay, the left rail lists all nine screens. Their order is the order you use them in: get connected first (Advanced → Providers), then watch what is happening (Dashboard → Account health → Usage details), then reconcile and tune (Statements → Settings).
Screen
What it answers
Dashboard
Is anything reachable right now, and how much money is left — total first, then per vendor
Advanced
Where the endpoint and token are, how the four tiers are ordered, when each quota window resets
Providers
Which vendors you hold accounts with — add, edit, pause them one by one
Account health
What state each one is in, and when the failing ones come back
Usage details
What just happened (by month / by day / by model / request log)
Relay guide
The in-panel quick start — no browser needed
Remote access
How to reach it safely from outside (Tailscale / Cloudflare Tunnel)
Statements
What did this week / month / quarter / year cost
Settings
Every switch: detection, tokens, budget, prices, cache, ledger, purge
Three steps to your first call
Prerequisite: at least one working account under Providers — paste an API key yourself, or pick a vendor from the official catalog. With nothing configured the relay has nothing to route to.
1. Open Advanced and check the four-tier route stack, already ordered from your accounts
2. Click Generate token on the same page to get a relay key plus an endpoint like https://your-domain/api/llm/relay
3. Paste both into your tool (ready-made snippets below) and restart it
4. Back on the dashboard: the live route log scrolls with your requests, and the Connected CLI tools card shows which tools already point here
The token is shown once. Lost it? Click Rotate — the old key dies immediately and you get a fresh one.
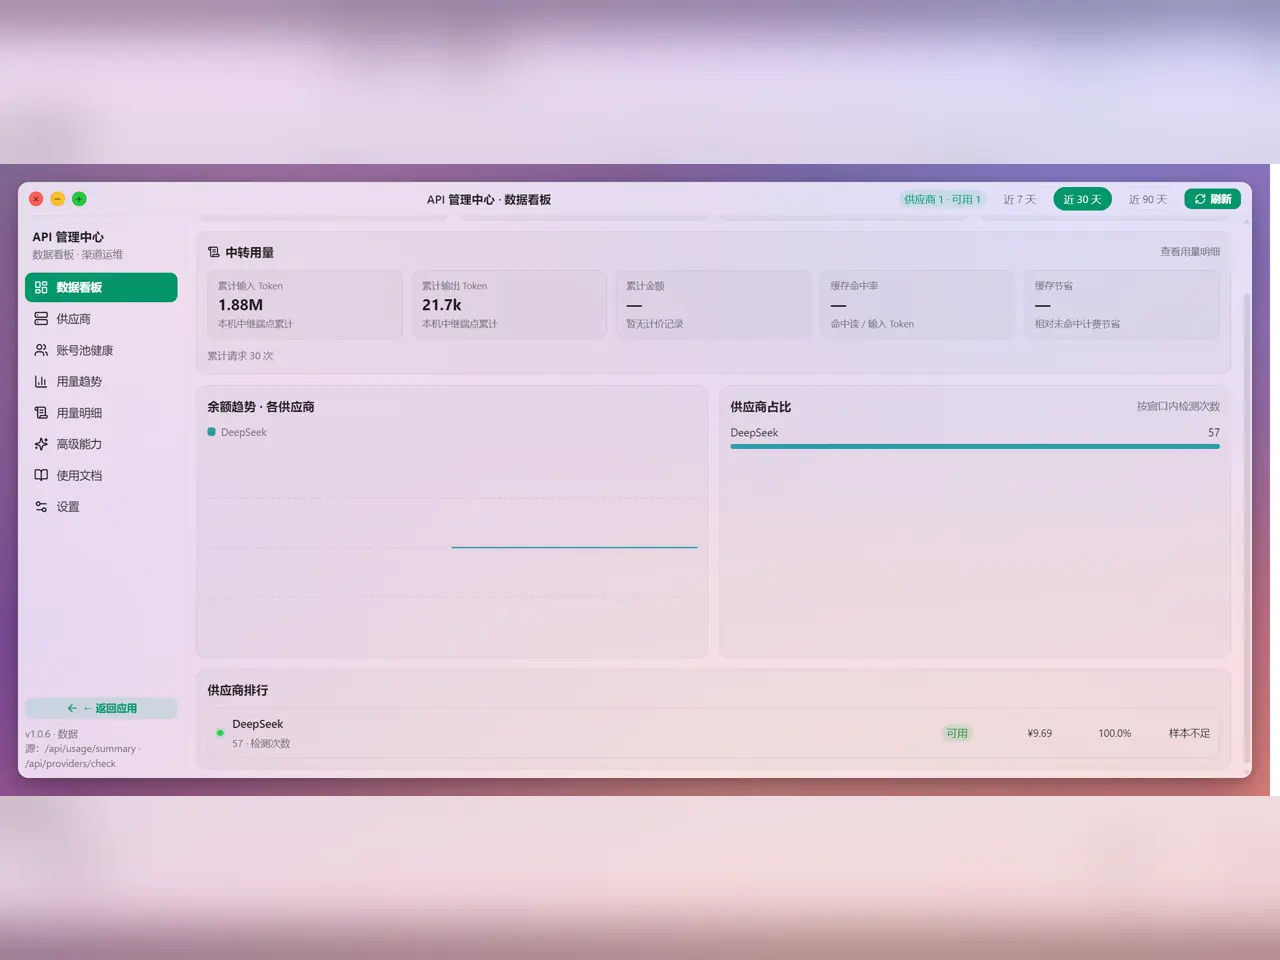
Diagram: once the token is issued, the API admin dashboard shows relay usage, balance trends and provider share, with 7 / 30 / 90 day windows on the right.
How to fill it into common tools
Every tool asks for the same three values: base URL, API key, model name. Always use https://your-domain/api/llm/relay and the key from the panel.
Bash# Cursor / Cline / Continue — any OpenAI-compatible tool
OPENAI_BASE_URL=https://your-domain/api/llm/relay
OPENAI_API_KEY=<relay token from the panel>
# Smoke test from the shell
curl https://your-domain/api/llm/relay/v1/chat/completions \
-H "Authorization: Bearer <relay token>" \
-H "Content-Type: application/json" \
-d '{"model":"gpt-4o-mini","messages":[{"role":"user","content":"hi"}]}'
Do not add a trailing slash, and do not append /v1 yourself — tools add it
URL too long to type? The Connected CLI tools card on the dashboard has a one-click copy row
Which model name? The relay supports standard model discovery (GET /v1/models) — most clients pull the model list themselves once pointed at the endpoint; you can also copy names from the per-provider list under Advanced → Available models
A wrong name comes back as “model unavailable” instead of silently switching
Toggling a tool on under Advanced → Connected CLI tools only feeds the list and the stats; it is not required for requests to work
Anthropic-protocol tools such as Claude Code connect directly too — they append /v1/messages to the same endpoint. Anthropic-family upstreams are passed through untouched (stream included); when only OpenAI-family upstreams remain the panel converts both directions and fails loudly instead of silently dropping fields
Providers: adding an account
Home for every account you hold, split three ways by credential source: API keys / free tiers / local inference. Each group has its own test-all button.
Manual: “Add OpenAI-compatible” or “Add Anthropic-compatible”, then fill name, base URL, key and model
From the catalog: search the official catalog, pick a vendor — endpoint and default model are prefilled, you only paste the key
Each card shows: health badge, last auto-probe error code (AUTH / 429 / 5XX), latency, and when it last failed
Three buttons per card: pause / resume, edit, delete; in the default order you can drag a card to change priority
Clicking a card opens its detail: model list, per-model connectivity test, set as default, disable models you do not use
Cannot find it? Use the search box, or the status filter beside it (all / healthy / failing / not configured)
Test-all only hits each vendor’s model-list endpoint — no tokens are consumed, so it cannot cost you anything.
Account health: who is alive, who is cooling
The check-up table: one row per account, with quota windows unfolded at the end of the row so you never have to click in.
Five counters up top: available / cooling / quota exhausted / manually paused / idle
The priority is fixed: manually paused > quota exhausted > cooling > available > idle — something you paused yourself always reads “paused”
Each row shows health, balance, availability with latency, and the quota window; pause or edit straight from the row
At most three quota windows are shown at once; “N more windows” expands the rest
A dash “—” means the upstream reported nothing remaining: unknown, not zero, and not used up
States come from a probe every five minutes plus real request failures. The probe only reads the model list — it costs nothing.
Dashboard: total first, then per vendor
The landing screen. Four cards on top are the health check (reachable count, total balance, P95 latency, availability); below them is what flows through the relay endpoint plus the live log. It ships switched off — enable Settings → Detection & stats → Usage stats and snapshots start accruing.
Metric
What it tells you
Caveat
Average availability / P95 latency
What share of upstream calls succeeded over the window, and how slow the slowest 5% were
Choose a 7 / 30 / 90 / 180 / 365 day window; more samples read steadier
Average daily spend
Mean cost per day from recent real usage
Swings widely when usage is bursty
Estimated days left
Current balance divided by daily average
A nudge, not a billing forecast — it drifts as habits change
Total and per-currency balance
Every vendor that reported a balance, summed per currency, followed by each vendor’s own balance listed one by one
Shown in original currency with no FX conversion; a vendor missing from the list simply did not report — unknown, not zero
Low-balance alert
Flags the dashboard and sends a notification below your threshold
Only fires if you set a budget or balance threshold
Dashboard history starts the moment you enable it — nothing is backfilled. Balance figures come from the providers and are for trend watching, not invoicing. To see what one vendor has left, read the per-vendor list under the total rather than guessing from the total.
How “fall over to the next account” decides
Quota window exhausted → next tier, and the panel marks it cooling
Upstream 429 → next tier, your session keeps running
Upstream down or timed out → next tier; only after all four fail does your tool see the error
Session stickiness: one conversation stays on the same account where possible, so earlier context is not invalidated mid-thread
You can see which tier is serving right now and every cooling countdown under Advanced — no guesswork required.
Token savings (RTK) and the ledger
Coding tools burn money on bulky repeated output (a whole directory tree, for example). With RTK on, the panel compresses that output before sending it upstream and reports the tokens saved.
Live route log: the dashboard lists the most recent requests — which tier took it, which account, which model, success or failure — refreshed every 5 seconds
Ledger: time, account, model, tokens, estimated cost, latency, status code — per request
Retention and export: the ledger keeps the last 300 rows by default (50–20,000 under Settings → Ledger), and the same row exports a detail CSV or a daily CSV
Custom prices: the built-in preset is a snapshot of each vendor list prices (as of 2026-10-20, standard tier / short context) — for models it lacks, or after a price change, fill input/output/cache-read/cache-write and pick CNY or USD under Settings → Price overrides; yours win, and no FX conversion is applied
Many accounts per tier: Settings → Intra-tier strategy picks round-robin / by weight / least-used (cooling accounts always go last)
Quota: when each account’s window resets, as a live countdown
Privacy exit: one button wipes the ledger and quota history
Cost is an estimate from public unit prices times real tokens — good for trends, not for invoicing.
Two cache switches (both in Settings, both off by default)
Caching is where the money is saved here, but the two switches do different jobs — do not mix them up.
Anthropic cache breakpoints: only touches Anthropic-native upstreams (/v1/messages). Once on, a cache_control breakpoint is added at the end of system and on the last user message, and cache reads bill at 0.1× — biggest win for long system prompts and long threads
That does rewrite the request body, but only on the Anthropic-native path; every other channel passes through untouched, and it is idempotent — a breakpoint you already set is never doubled
Exact cache: an identical request (same BestNav account, same path, same body) replays the previous response within the TTL instead of going upstream; 300s by default, 30–86,400s configurable
Only non-streaming successful responses are cached; streaming and failures never are
A replay still writes a ledger row (type = cache), visible in the CSV export — nothing happens off the books
Both default to off. Exact cache keeps requests and responses in the server process memory (cleared on restart) — skip it on shared machines or when content must not persist.
Statements: reconcile by week, month, quarter or year
A "last 7 days" window counts backwards from today — it answers "has it been busy", not "what did March cost". So reconciliation lives in its own Statements view: pick a granularity (week / month / quarter / year), then pick the period, and only that period is counted.
Granularity
How it is cut
What it answers
Weekly
ISO weeks starting Monday (a year-straddling week belongs to the year holding its Thursday)
Did this week burn more than last week
Monthly
Calendar month, 1st to month end
Month-end reconciliation, the number you show your boss
Where the numbers come from: Statements read the daily rollup — every metered call also accumulates into its day, so requests, tokens and cost are full-period totals, not a sample of "the latest N rows". Amounts are listed per currency (e.g. $1.25 · ¥8.00): no exchange-rate conversion, and two currencies are never summed into one figure. The by-provider column is meant to be reconciled against what each vendor says it actually spent.
Retention: daily rollups keep 400 days (a little over a year); per-request detail keeps rows (default 300, configurable to 50–20000 under Settings → Ledger). If a period starts before the retention floor the view flags it as incomplete — do not treat it as a full period. Need long history? Export the daily CSV first.
To reclaim space deliberately: Settings → Ledger → "Purge older than N days". Enter a number, confirm, and it removes the per-request entries and the daily rows for those days together, then reclaims disk space (SQLite does not shrink on DELETE, so a purge runs one reclamation pass).
Purging cannot be undone — export both the ledger CSV and the daily CSV before you do it
A purged period shows up as incomplete or disappears from Statements; that is missing data, not missing statistics
If the database merely feels big and you do not want to lose history, lowering the retention row cap is safer — it only affects per-request detail, never the daily rollup
Upstream health probe: know a vendor is down before a request does
Every 5 minutes the panel sends a tiny probe to each upstream (the model-list endpoint only) and records the result as a status band, so you can see it in the account pool and under Advanced without waiting for a real request to fail.
Probes do not use your business channel and consume no tokens, so they cannot generate charges
Five status bands: available, cooling (rate limited or upstream fault), quota exhausted, manually disabled, idle (not yet probed)
Cooling accounts show a countdown in the tier list, so you never have to guess
Advanced → Available models lists names verified reachable, each one click to copy
Manual disable is for maintenance: disabled accounts stop routing and are not auto-restored by the probe
The probe only tells you something is probably unreachable. Actual failover still keys on the four real signals: quota, rate limit, fault and timeout.
The Settings page: what each control actually does
Tokens: create / name / cap (token quota, request quota, per-minute limit) / model allow-list / expiry, revocable anytime
Budget breaker: daily and monthly ceilings per currency; once exceeded nothing goes upstream (currencies are never summed together)
Global aliases: give a tool a short name that routes to a real model — change the upstream in one place only
Price overrides: add unit prices (and the billing currency, CNY or USD — no FX conversion) for models the built-in preset lacks; beyond input and output you can set cache read, cache write (including the 1 h tier), per-call price, off-peak half pricing and long-context bands, plus a markup multiplier for resellers
Anthropic cache breakpoints / exact cache: see the previous section; both off by default
Ledger: retention count and the two CSV exports
Intra-tier strategy: how traffic is split across accounts in the same tier
Settings only holds things you can change; read-only observations such as upstream health and available models live under Advanced.
Remote access: using it from outside
This page answers “how do I get in”. It does not change the egress IP your upstream sees — upstreams still see the network your server sits on.
Tailscale: once the mesh is up, reach the panel and the relay endpoint on their LAN addresses — smallest change of all
Cloudflare Tunnel: if you own a domain, point a tunnel at the panel port; no router holes required
The page only shows “configured / not configured”; verify real reachability yourself once
The moment it is reachable from the internet, add HTTPS and access control; if a token may have leaked, rotate first
The relay endpoint is rate limited to 120 req/min by default: your own gateway, not a shared egress.
Safety notes
The relay key is a credential for your panel. Exposing it over the public internet without HTTPS is the same as hanging your keys on the gate
LAN only? Do not port-forward. Need remote access? Add a domain, a certificate and access control
Rotate anytime: the old key dies immediately, then read the ledger for anything odd
Your upstream API keys are never stored in plaintext where they can be casually read, including in exports
Built-in and WebDAV backups carry the relay configuration, issued tokens and a consistent snapshot of the ledger, so tokens survive a reinstall
The relay endpoint is rate limited (120 req/min by default) — it is a personal gateway, not a company-wide one
FAQ
401? Wrong or rotated token — copy a fresh one (watch for a trailing space)
“Model unavailable”? That model is not in any tier’s list; pick another name or re-check the providers in the panel
Tool cannot connect? Make sure the tool and the panel are on the same network (a LAN address is unreachable from the internet)
Streaming cut off? The relay already relaxes write deadlines for long answers (10 minutes); if it still breaks, check your own reverse proxy — Nginx needs proxy_buffering off
Can I keep no records? Yes — the panel exposes a wipe-ledger-and-quota action
Reading a subscription window: upstream vs local estimate
Every window in the Quota card has its own countdown; when it runs out the request moves to the next channel — nothing to do by hand.
Upstream value: the remaining amount the provider reports in response headers. Most trustworthy; no header means no number
Local estimate: the limit you entered plus what this server counted from requests actually sent — not confirmed upstream, so it is tagged “local estimate”
A dash “—” means the upstream did not report a remaining amount: unknown, not zero, and not “used up”
Once exhausted we retry at most 6 hours later, so a channel is never locked out for long
If it says the limit may be too small: the local count hit the cap while the channel kept answering — adjust the limit to your real plan
Quota breaker vs budget breaker
They look similar but judge different things:
Budget breaker (daily/monthly limits) looks at money spent, per currency, no FX conversion
Quota breaker looks at how much a single window has left — a window can be used up without spending anything
Either one sends the request to the next channel; both at once means “no candidate is available”
We only change our own books: resetting a local window clears this server’s estimate, and recording a reset credit is bookkeeping only — neither redeems quota from the provider.
Diagram: the two breakers decide independently; either one hands the request to the next channel, and only when nothing is left does your tool see an error.