网络流量监控
把 NAS 的网卡与每个容器的收发量记成可回看的历史:分钟、小时、天三级粒度分层保留,最长能翻到一年前,并且能回答「这台机器上到底是谁在用带宽」。
4 个小节 · 约 2 分钟读完
你能看到什么
顶部三块常驻指标:实时上下行速率、所选区间的累计收发(含上下行占比)、峰值速率与峰值出现的具体时刻。下面还有 95 分位速率(按 5 分钟桶计算,用来滤掉瞬时毛刺)、日均下行,以及一条贯穿整个区间的收发速率趋势曲线。
- 区间:今日 / 24 小时 / 7 天 / 30 天 / 90 天 / 按月 / 近一年,按月可以指定具体月份
- 网卡明细:只列整机物理接口,lo、docker、veth 这类虚拟与桥接口自动过滤,给出区间下载、上传与占比
- 软件流量排行:同一软件的多个容器(主程序 + 数据库 + 侧车)按 Compose 项目归并成一行,直接看谁在吃带宽
- 阈值事件:超过设定速率会留下事件记录,阈值随时可改
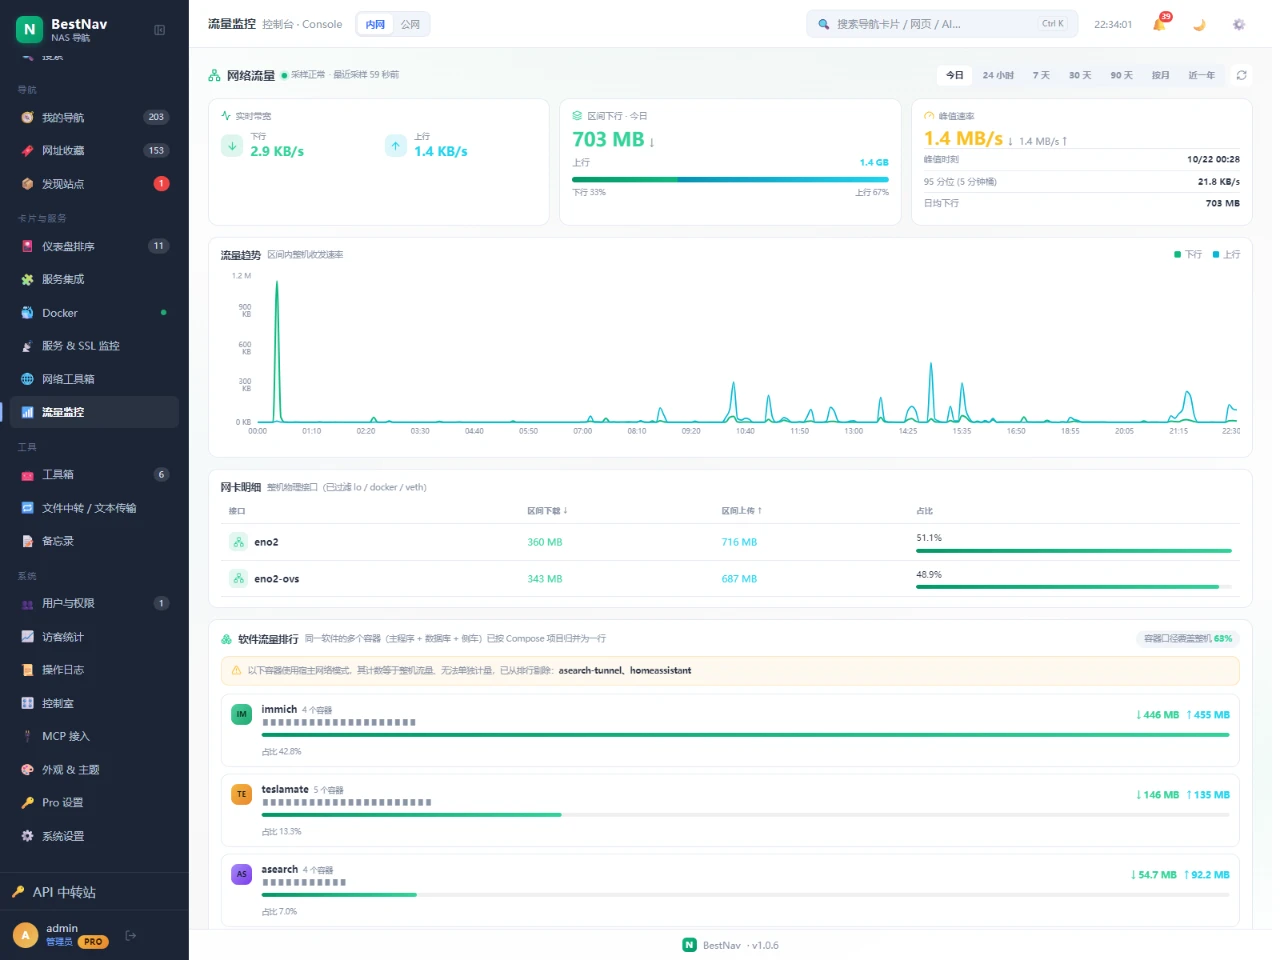 图:流量监控整页(控制台视图)。镜像仓库地址等主机标识已做遮盖处理,其余为真实运行数据。
三级粒度是怎么留数据的
采样每 60 秒一次。如果所有数据都按分钟存,一年下来会非常占地盘,所以按「越近越细」分层保留:
- 分钟级:保留最近 48 小时——够你回看昨天半夜那次备份把网络打到多高
- 小时级:保留最近 90 天——够看一个季度的用量走势
- 天级:保留最近 366 天——够回答「去年这个时候有没有这么忙」
切换区间时页面会自动选到对应粒度,不需要你手动挑;选「按月 / 近一年」时读到的是天级数据。
数据从哪来,为什么有的容器不在排行里
整机口径读主机网卡计数,软件口径读 Docker Engine API 给出的每个容器网络计数,两者都是本地读取,不经过任何外部服务。
- 使用宿主机网络模式的容器(host network)没有独立计数,它的流量已经算在整机里,无法单独归因,因此会被移出排行并在页面上明确提示,而不是给你一个假的数字
- 排行上方会显示「容器口径覆盖整机」的百分比——这个比例越低,说明越多流量来自无法单独计量的容器
- 已删除的容器不再出现在排行里,但历史数据保留,切到对应区间仍能看到它当时用了多少
在哪看,要不要 Pro
两处入口:实时带宽卡片上点开详情浮层(免费功能,四套模板都能用);控制台与桌面视图侧栏的「流量监控」整页(这两套模板属 Pro)。数据读取只需要监控读权限,不额外收费。
- 阈值修改仅管理员可操作
- 采样与查询都在本机完成,流量数据不出你的 NAS
- 如果存储初始化失败,该功能会整体降级为不可用并在日志中告警,不会影响面板其他部分
What you get
Three permanent tiles up top: live up/down rates, cumulative transfer for the selected range (with the download / upload split), and the peak rate together with the exact minute it happened. Below them sit the 95th-percentile rate (5-minute buckets, so a single spike cannot masquerade as your normal load), the daily average download, and a trend curve spanning the whole range.
- Ranges: today / 24 h / 7 days / 30 days / 90 days / by month / last year — by month lets you pick a specific month
- Interface detail: physical interfaces only; lo, docker and veth virtual and bridge interfaces are filtered out, each row showing range download, upload and share
- Software ranking: the several containers of one app (main + database + sidecar) collapse into a single row by Compose project
- Threshold events: breaching the configured rate is recorded, and the threshold is editable
The traffic page in the Console template. Registry addresses and other host identifiers are masked; everything else is live data.
How the three tiers keep history
Sampling runs every 60 seconds. Storing a year of minute data would eat the disk, so retention is finer the closer you look:
- Minute grain: last 48 hours — enough to revisit how high the network spiked during last night’s backup
- Hourly grain: last 90 days — a full quarter of usage shape
- Daily grain: last 366 days — answers whether this time last year was this busy
Switching ranges picks the right grain automatically; choosing by month or last year reads the daily tier.
Where the numbers come from
Host totals are read from the machine’s NIC counters; per-app totals come from the Docker Engine API’s per-container network counters. Both are local reads — nothing goes to an external service.
- Containers on host networking have no separate counters — their traffic is already inside the host total and cannot be attributed, so they are removed from the ranking and the page says so explicitly rather than showing you a made-up number
- A "container coverage of the host" percentage above the ranking tells you how much traffic comes from containers that cannot be measured separately
- Deleted containers leave the ranking but keep their history — switch to the range and you still see what they used
Where to open it, and is it Pro
Two entry points: the detail overlay on the live-bandwidth card (free, available in all four templates), and the full Traffic page in the sidebar of the Console and Desktop templates (both Pro). Reading the data only needs monitor read permission — there is no extra charge.
- Only an admin may change the threshold
- Sampling and queries run entirely on your machine; traffic data never leaves your NAS
- If the history store fails to initialise, the feature degrades to unavailable and logs a warning — the rest of the panel is unaffected